4.0 Vert., Horiz., & Slope - Introduction
4.0 Vert., Horiz., & Slope - Introduction Anonymous (not verified)The material in Chapter 4 describes estimates of flame length, flame height, angles, degrees, and slopes. Reading clinometers and graphs and pacing out a chain are also covered.
4.1 Flame Length
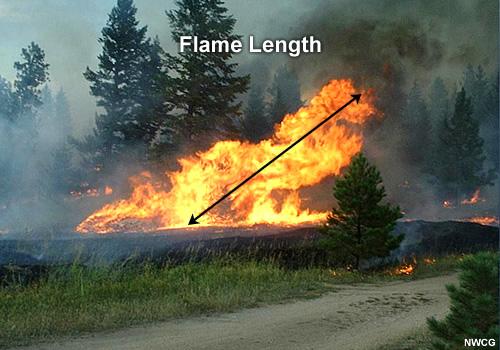
4.1 Flame Length Anonymous (not verified)Flame length is the distance measured from the average flame tip to the middle of the flaming zone at the base of the fire. It is measured on a slant when the flames are tilted due to effects of wind and slope. Flame length is an indicator of fireline intensity.
4.2 Flame Height
4.2 Flame Height Anonymous (not verified)Flame height is the average height of flames as measured vertically, up and down. It may be less than flame length if the flames are angled in the horizontal direction, backward or forward.
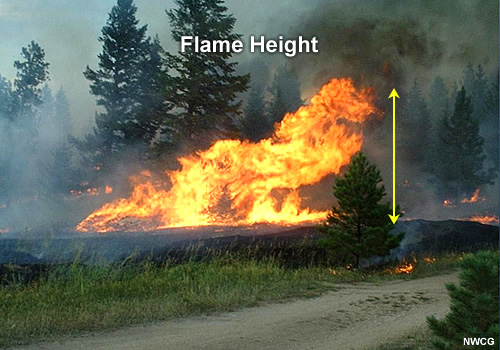
Flame height can be approximated by comparing the flame to an object of known dimensions, such as a pole, fencepost, or firefighter.
4.3 Angles
4.3 Angles Anonymous (not verified)Angles are formed when two or more lines come together at a point. The angle in the image below is 45 degrees. A right angle, where the two lines are perpendicular to each other, is 90 degrees. The closer together the two lines, the smaller the angle.
Firefighters use angles everyday. Angles can help determine position using a compass or on a map. The slope of an incline can be expressed as an angle, and can be a deciding factor in whether a dozer can drive safely up the incline. Angles also provide information about the steepness of slope to determine potential effects on fire spread.
4.4 Degrees and Protractor
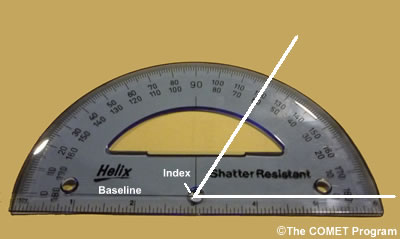
4.4 Degrees and Protractor Anonymous (not verified)Degrees are the unit of measure used for angles, just as feet are used to measure distance. The symbol for degrees is "°". There are 360° in a full circle, and 90° in a right angle. A protractor is used for measuring angles. As shown below, a protractor is a half or full circle measuring device, marked in degrees along the outer edge, with a straight line running from 0° to 180°. There is a small hole in the center of the protractor. To use a protractor:
- Place the hole of the protractor over the point of the angle where the lines meet.
- Make sure one side of the angle is on the zero line.
- Read the degrees off the protractor where the line of the other side is or mark a point along the edge at the appropriate angle measurement.
Example 1 - Part A. Measure angles 1, 2, and 3 using a protractor to follow the steps above.
You should find that the angles measure as follows:
Part B. What is the sum of angles 1 and 2? How does that number compare to angle 3?
The sum of angles 1 and 2 is 180 degrees. Angle 3 also equals 180 degrees. Angle 3 is a straight line, so it follows that the sum of angles 1 and 2, 180°, is also a straight line.
Part C. Add angles 1, 2, and 3. The sum of angles 1, 2, and 3 equals 360 degrees.
There are 360 degrees in a circle and angles 1, 2, and 3 together complete the circle.
4.5 Slope
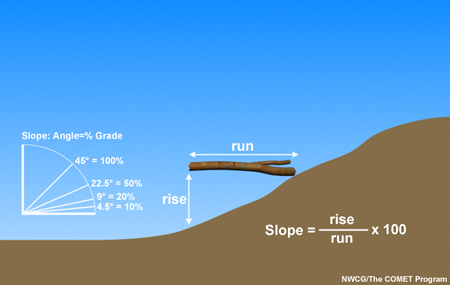
4.5 Slope Anonymous (not verified)Slope refers to the angle, or grade, of an incline. Slope can be upward or downward. Slope is typically expressed as a percent, and corresponds to the amount of rise, or vertical distance, divided by the run, or horizontal distance. Percentage means per 100. Slope can also be expressed as an angle, which gives the amount of deviation from flat as a number of degrees. Conversions between slope percent and slope angle can be done using a scientific calculator and the inverse tangent (arc tan) function. Essentially, the slope angle is the inverse tangent of the slope percent (with slope percent expressed in decimal).
Example 1 - The slope percent is 60 percent. What is the slope angle?
Step 1. Change 60 percent to decimal form. Sixty percent means 60 out of 100. It can be written 60/100 = 0.60. See Chapter 1.
Slope angle = inverse tan of the slope percent (in decimal)
Slope angle = inverse tan of 0.60
Step 2. Enter .6 into the calculator and push the inverse, inv, or "2nd" button, then the tan button to get the inverse tangent. The calculator will show the slope angle.
A 60 percent slope corresponds to a slope angle of 31°.
MEASURING SLOPE PERCENT
Slope percent can be measured using a clinometer or slope meter, or by dividing the rise by run, as described in this multimedia tutorial. Click the graphic below to view the lesson, which includes audio.
Click on the above graphic to view a slope measurement tutorial.
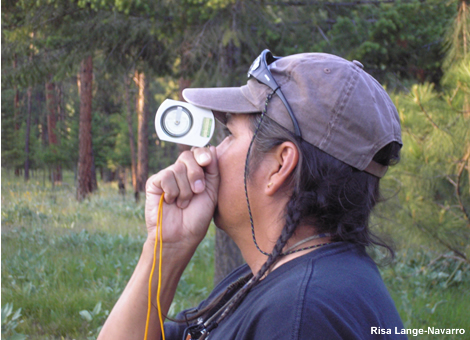
If you have a clinometer or other digital device for measuring slope percent in the field, sight the clinometer as outlined below:
1. Open both eyes to sight the object and read the scale.
2. Verify which scale is being read. There are two scales in the viewfinder: a percent slope scale on the right margin and a slope angle scale on the left margin. The vertical angle is in degrees.
3. Sight the clinometer from eye level to the object or to a distant point that is also at about eye level.
4. Read the scales for percent slope or degree of slope.
Note that in uneven terrain, the clinometer should be placed on a pole at eye level and read to a distant point on another pole of the same height to obtain a more accurate reading.
Example 2 - Use the rise and run measurements in the figure below to estimate the slope percent.

Slope percent = (8 feet / 40 feet) × 100 = 0.20 × 100 = 20%
The slope percent is 20 percent.
CALCULATING HORIZONTAL DISTANCE
If the slope and the vertical distance (rise) are known, then the horizontal distance (run) can be calculated. The slope percent equation can be rearranged to provide the equation for the horizontal distance.
Slope percent = (rise / run) × 100
Rearrange the terms of equation: multiply both sides by run.
run × slope % = rise/run × 100 × run
Divide both sides by slope percent.
( run × slope %) / (slope %) = (rise × 100) / (slope %)
run = (rise × 100 ) / slope % is a measure of horizontal distance.
Example 3 - A hill has a slope of 8 percent. The height of the hill is 15 feet. What is the horizontal distance?
horizontal distance = run = (rise × 100) / slope %
Step 1. Enter the given values into the equation.
Step 2. Solve.
run = ((15 ft × 100) / 8) = (1500 ft / 8)= 188 ft
The hill has a horizontal distance of 188 feet.
CALCULATING SLOPE DISTANCE
Slope distance (h) is the length of slope from the bottom to the top of the slope and is larger than both the vertical and horizontal distance.
Slope distance can be calculated when the vertical height (rise) and the horizontal distance (run) of a right angle are known. There is a right angle if the vertical and horizontal distances are "true" to the vertical and horizontal, respectively. See the following figure, which denotes x as run and y as rise. To calculate slope distance, you will need a basic scientific calculator with a square root (√z ) function.
Example 4 - Find the slope distance for the vertical and horizontal distances illustrated in the figure below.
Step 1. Use the equation h = √(x2+ y2)
slope distance =
√ [(horizontal distance)2 + (vertical distance)2]
Step 2. Change all the values to the same units, in this case feet. The conversion factor is 12 inches = 1 foot.

Step 3. Plug the values into the equation and solve.
h = √ (x2 + y2)
h = √[(41.7 ft × 41.7 ft) + (9.3 ft × 9.3 ft)] = √ [(1738.9 ft2 + 86.5ft2)]
h =√ (1825 ft2) = 42.7 ft
What is the slope distance in feet and inches?
h = 42 ft + 0.7 ft × 12 in/1 ft = 42 ft 8 in
See Chapter 2, Section 2.1 for a review of unit conversions.
h = slope distance = 42.7 ft or 42 ft 8 in
4.6 Chain, Pace, Walking a Chain
4.6 Chain, Pace, Walking a Chain Anonymous (not verified)A chain is equal to 66 feet and is the basic unit for measuring distances in fire-control work. There are 80 chains in 1 mile.
A pace is the distance on level ground between the heel of one foot and the heel of the same foot where it next touches the ground while walking normally (two normal steps). As everyone's pace differs, it is important to determine one's individual pace length.
Walking a chain or chaining - To walk a chain, measure several chains on level ground with a steel tape, marking each chain with a stake. Walking normally from one stake to the other, count the paces. Divide by the number of chains that were measured off to get the number of paces per chain. A person's pace will change depending on whether pacing is uphill or downhill. In these situations, the number of paces per chain will need to be recalculated as above.
Example 1 - Victor marks off 3 chains or 198 feet (66 feet × 3 = 198 feet). He walks the distance in 36 paces. How many paces per chain is this? What is the length of each pace?
36 paces / 3 chains = 12 paces / chain
Set up the appropriate unit cancellation (see Chapter 2, Section 2.1) using 1 chain = 66 feet and solve for length of each pace.
The length of Victor's pace is 5 & 1/2 feet.
4.7 Graphs
4.7 Graphs Anonymous (not verified)Graphing is a method of showing the relationship between two or more sets of data by means of a chart or sketch. Trends in data are easier to identify with a graph than a data table.
A graph can be created using graphing paper (you purchase gridded paper or draw your own), a computer application such as Excel, or graphing applications for a personal digital assistant (PDA) or phone. A graph shows a set of data points plotted in relation to the horizontal axis and vertical axis.
Example 1 - Draw a graph for pump performance showing the relationship between pressure (psi) and flow (gpm). Use the following table of pump performance data values.
Step 1. Pump performance charts are typically drawn with the flow on the horizontal axis and pressure on the vertical axis. Label the horizontal axis as flow in gallons per minute. Label the vertical axis as pressure in pounds per square inch.
Step 2. Mark the horizontal axis from 0 to 90 in even increments. Mark the vertical axis from 0 to 300 in even increments of 25 pounds per square inch, as the data points were collected in increments of 25 pounds per square inch.
Step 3. Plot each data set by finding the pressure value on the vertical axis and then the flow value on the horizontal axis. Mark (plot) a point where the two values meet. Continue plotting points for all data sets.
Step 4. Run a curved line through the points. Not all the points will be on the curve, some of the points will lie above the line and some below. Special statistical calculations are used to determine how far off the curve a data point can be and still be meaningful. Typically, if the point is off the curve enough to affect the shape of the curve, the data set should be rerun.
USING A GRAPH TO FIND APPROXIMATE VALUES
A curve can be used to find approximate values for data in between the data sets collected. The curve can also be used to show performance trends. For example, this curve shows that as pressure is decreasing, the flow rate increases proportionally throughout the range of performance.
Example 2 - Using the graph above, find the indicated flow rate at a pressure of 263 pounds per square inch (psi).
Step 1. Approximate the location of 263 pounds per square inch on the pressure axis. This location is approximately halfway between 275 and 250 pounds per square inch.
Step 2. Move horizontally until the curved line is met.
Step 3. Move vertically from the curved line to the flow rate axis. Read or approximate the flow rate.
The flow rate at 263 psi is 35 gallons per minute.
DETERMINING THE SLOPE OF A CURVE
The slope of a line can be determined from a plot using the slope formula.
slope = rise/run
Example 3 - Find the slope of the line drawn on the plot above for the interval between 50 and 150 pounds per square inch.
It's important to be aware what interval is being used, because the line drawn is a curve and the slope will change with each section of line.
Note from the curve that as the pressure varies from 50 to 150 pounds per square inch, the the flow rate varies from about 79 to 63 gallons per minute.
Pressure, pounds per square inch, is on the vertical axis, so it is the rise. Flow rate, gallons per minute, is on the horizontal axis, so it is the run.
Slope = rise / run = ((150 - 50) psi / 63 - 79) gpm = 100 psi / (-16 gpm) = -6 psi/gpm
The slope is -6 psi/gpm. The negative slope indicates that as the horizontal value (flow rate) increases, the vertical value (pressure) pressure decreases.
READING DISTANCE FROM A MAP CHART
Maps are generally broken into grids and labeled on the vertical and horizontal axes for ease of locating places or numbers. If the vertical and horizontal values are known, the area on the map can be obtained by finding where the two lines intersect or cross. Charts accompanying the map provide information about the distance between different map locations. By reading the appropriate values from those horizontal and vertical axes.
Example 4 - Use the mileage chart below to find the distance between Tampa, FL, and Albuquerque, NM.
Step 1. Locate Tampa on the horizontal axis. Draw a vertical line through these grids.
Step 2. Locate Albuquerque on the horizontal axis. Draw a horizontal line across these grids.
Step 3. Read the mileage amount where the two lines cross
The distance between Tampa and Albuquerque is 1,760 miles.