5.0 Mapping - Introduction
5.0 Mapping - Introduction Anonymous (not verified)The material in Chapter 5 describes calculating area and perimeter of a burn, fire spread distance, and effective windspeed. Detailed descriptions are provided for reading and using a map scale, converting map to ground distances, and using topographic maps.
5.1 Burn Area and Perimeter
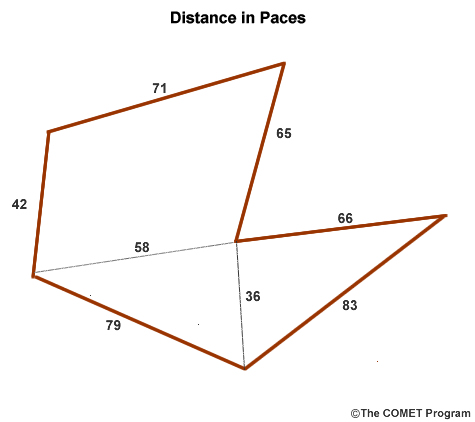
5.1 Burn Area and Perimeter Anonymous (not verified)The perimeter is the distance around the fire or along the handline. Perimeter is determined by adding the lengths of the various lines that enclose the black area of a fire. Because fires often burned in unusual shapes such as fingers, the perimeter of a fire can be approximated by assembling a combination of known shapes and lines.
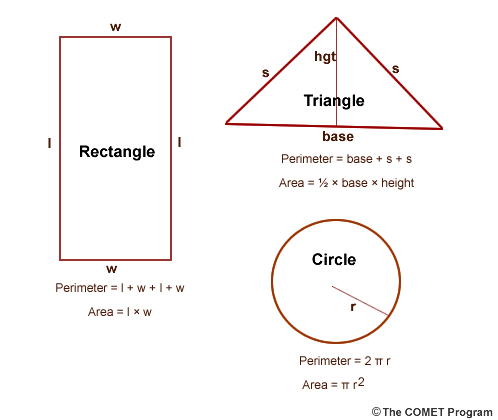
Area is the amount of surface covered within a given perimeter and is useful in determining burnout acreage. Area is always in square units: for example, square feet (ft2), square yards (yd2), or acres, which represents a square distance.
A square, rectangle, and triangle are shown in the following figures, with their formulas for area and perimeter.
Determining perimeter and burn area after a fire is often necessary. Average dimensions for a sketch can be obtained by pacing or walking around and through the burn. This method is especially useful for small fires. Global Positioning Systems (GPS) are used for larger fires to determine their shape, area, and perimeter.
Example 1 - John sketched the following burn shape in his firefighter's notebook. Use this information to determine the acreage of the fire. John's pace is 12 paces per chain.
Step 1. Set up the cancellation table so all units will cancel, except the desired unit, chains.
Step 2. Take the average of the two widths. The average width = 8.5 chains + 3.5 chains / 2 = 12 / 2 = 6 chains.
Step 3. Use the equation for determining the area of a rectangle.
Area of rectangle = length × average width
Area = 10 chains × 6 chains = 60 square chains.
Step 4. Set up the cancellation table so all units will cancel, except the desired unit, acres.
The area of the fire is 6 acres.
ACREAGE GRID
A clear acetate/plastic dot acreage grid can be placed over the mapped sketch of a burn area. It is important that the plastic grid overlay and burn map have the same scale. Burn area is determined by counting the number of dots inside the sketch of the burn. For dots that are on the border of the burn sketch, count every other dot. Multiply the number of dots counted by the dot conversion factor. This conversion factor is typically indicated on the bottom of the plastic overlay.
Example 2 - Janie sketched out a burn area in the following shape on a 7.5 minute USGS quadrangle map. The U.S. Geological Survey (USGS) produces a series of standard maps to various scales. The 7.5 minute map series has a 1:24,000 scale. One inch on a 7.5 minute map represents 2,000 feet on the ground. (See Chapter 6, Latitude and Longitude, for more information.) Use the acreage grid overlay to determine the area of the fire.
Step 1. Count the number of dots within the shape. Count every other dot for dots on the borderline. There are 181 dots.
Step 2. Read the overlay scale to obtain the dot-grid conversion. In this case the conversion is 2.500 acres per dot.
Step 3. Set up the cancellation table so all units will cancel, except the desired unit, acres.
The area of the above figure is about 453 acres.
5.2 Map Scale
5.2 Map Scale Anonymous (not verified)The map scale is printed in the map legend. It is given as a ratio of inches on the map corresponding to inches, feet, or miles on the ground. For example, a map scale indicating a ratio of 1:24,000 (in/in), means that for every 1 inch on the map, 24,000 inches have been covered on the ground. Ground distances on maps are usually given in feet or miles.
Map Scale Conversion Factors
| Scale | Representative Fraction | Map in/mi | Map in/ch | map ft/in |
|---|---|---|---|---|
| 1:253,440 | 253.44 | 0.25 | 0.0031 | 21,120 |
| 1:126,720 | 126.72 | 0.50 | 0.0063 | 10,560 |
| 1:63,360 | 63.36 | 1.00 | 0.0125 | 5,280 |
| 1:62,500 | 62.50 | 1.01 | 0.0127 | 5,208 |
| 1:31,680 | 31.68 | 2 | 0.025 | 2,640 |
| 1:24,000 | 24.00 | 2.64 | 0.033 | 2,000 |
| 1:21,120 | 21.12 | 3 | 0.038 | 1,760 |
| 1:15,840 | 15.84 | 4 | 0.05 | 1,320 |
| 1:7,920 | 7.92 | 8 | 0.1 | 660 |
Table 5.1. Map Scale Conversion Factors
Example 1 - Convert the map scale of 1:24,000 (in/in) to (in/ft).
Step 1. Set up the cancellation table so all units will cancel, except the desired unit, ft/in.
On the map 1 inch is equal to 2,000 feet on the ground, 1:2,000 (in/ft).
Example 2 - Convert the 1:2,000 (in/ft) to (in/mile).
Step 1. Set up the cancellation table so all units will cancel, except the desired unit, miles/inch.
On the map 1 inch is equal to 0.4 miles.
Example 3a - The map distance between two points is 6 inches. The map scale is 1:24,000 (in/in). What is the ground distance in feet?
Set up the cancellation table so all units will cancel, except the desired unit, feet.
The ground distance is 12,000 feet.
USING THE MODIFIED ACREAGE GRID (TRANSPARENCY)
To use the acreage grid transparency, follow these steps:
Map Scales and Equivalents
| Scale | Inches per mile | Acres per square inch | Conversion factor that each dot equals |
|---|---|---|---|
| 1:20,000 | 3.168 | 63.769 | 1.736 Acres |
| 1:24,000 | 2.640 | 91.827 | 2.500 Acres |
| 1:62,500 | 1.014 | 622.449 | 16.946 Acres |
| 1:63,360 | 1.000 | 640.000 | 17.424 Acres |
Table 5.2 Acreage Grid Overlay, Map Scales, and Equivalents.
- Place the acreage grid transparency over the area to be measured.
- Count dots inside the sketched area. Count every other dot when dots fall on the boundary line.
- Multiply the total number of dots by the conversion factor on the map scale to determine the total acreage. (See Table 5.2.)
- Example 3b - Using the information in Example 3a, find the ground distance in chains, miles, and inches.
Step 1. Set up the cancellation table so all units will cancel, except the desired unit, chains.
12,000 feet = 182 chains
Step 2. Set up the cancellation table so all units will cancel, except the desired unit, miles.
Step 3. Set up the cancellation table so all units will cancel, except the desired unit, inches.
12,000 feet = 182 chains = 2.3 miles = 144,000 inchesOccasionally, a map may not provide a scale. The scale can be calculated by knowing the distance between two points on the map, and measuring the distance on the map. Also, if a map has section lines, the distance between section lines is typically 1 mile.
Example 4 - The distance between point A and B is 6 inches on the map. The known ground distance is 3,600 feet. What is the scale in units of inches/foot?
The map scale is 1:600 inches/foot.
Example 5 - Use the map scale in example 6. The known ground distance between points B and C is 1/2 mile. How many inches is does this distance correspond to on the map?map scale = known distance / measured distance
Rearrange terms by multiplying each side by the measured distance and dividing each side by the map
scale.measured distance = known distance / map scale
Step 1. Set up the cancellation table so all units will cancel, except the desired unit, feet.
Step 2. Use the map scale from Example 6 to find the map distance.
measured distance = known distance
map scale
measured distance = 2,640 feet 1 inch = 4.4 inches
600 feet
On the ground one-half mile is the same as 4.4 inches on the map.
5.3 Spread Distance
5.3 Spread Distance Anonymous (not verified)Spread distance (SD) is the forward distance a fire spreads in a given amount of time. SD can be calculated from rate of spread (ROS) and projected time (PT).
Spread Distance = Rate of Spread × Projected Time
SD = ROS × PT
Example 1 - What is the spread distance, in feet, for a fire that has a rate of spread of 6 chains per hour for a 3-hour time span?
Step 1. Use the equation for determining the spread distance.
Step 2. The answer needs to be in feet. Set up the cancellation table so all units will cancel, except the
desired unit, feet.
The spread distance is 1,188 feet.
Example 2 - Using the information in Example 1, find the map distance of the fire spread. The map scale is 1:31,680 (inch/inch).
Step 1. Convert inch/inch to feet/inch. Set up the cancellation table so all units will cancel, except the desired unit, feet/inch.
Step 2. Convert the ground spread distance to a map spread distance.
The map distance is 0.45 inches.
MAP SPREAD WORKSHEET
These values can be summarized in a Map Spread Worksheet.
Map Spread Worksheet (blank version)
| Line | Input | |||
| 0 | PP | Projection point | ______ | ______ |
| 1 | ROS | Rate of spread, ch/h | ______ | ______ |
| 2 | PT | Projection time, h | ______ | ______ |
| 3 | SDCM | Spread distance, ch (line 1 x line 2) | ______ | ______ |
| 4 | SDFT | Spread distance, ft (line 3 x 66 ft/ch) | ______ | ______ |
| 5 | SCL | Map scale | ______ | ______ |
| 6 | CF | Conversion factor, ft/in (see map scale conversion) | ______ | ______ |
| Output | ||||
| 1 | MD | Map spread distance, in (line 4 divided by line 6) | ______ | ______ |
Map Spread Worksheet (completed)
| Line | Input | |||
| 0 | PP | Projection point | A | Given |
| 1 | ROS | Rate of spread, ch/h | 6 | Given |
| 2 | PT | Projection time, h | 3 | From ex. 1 |
| 3 | SDCM | Spread distance, ch (line 1 x line 2) | 18 | From ex. 1 |
| 4 | SDFT | Spread distance, ft (line 3 x 66 ft/ch) | 1188 | From ex. 9 |
| 5 | SCL | Map scale | 1:31,680 | From ex. 2 |
| 6 | CF | Conversion factor, ft/in (see map scale conversion) | 2640 | From ex. 2 |
| Output | ||||
| 1 | MD | Map spread distance, in (line 4 divided by line 6) | .45 | from ex. 2 |
When completing the map spread worksheet, notice that the projection point is line zero. Line 1 begins with the rate of spread.
Fire Area Size Worksheet
| Line | Input | ||
| 0 | PP | Projection point | ______ |
| 1 | ROS | Rate of spread, ch/h | ______ |
| 2 | EWS | Effective windspeed, mi/h | ______ |
| 3 | PT | Projection time, h | ______ |
| 4 | SDF | Spread distance, ch | ______ |
| Output | |||
| PER | Perimeter, ch | ______ | |
| AC | Area, ac | ______ |
FORWARD RATE OF SPREAD
The shape of a fire is dependent on slope and effective windspeed. The higher the windspeed and slope percent, the longer, more cigar-shaped the burn area.
Click to view animation of slope and wind effects on fire

Safety dictates that firefighters be positioned at the flanks (sides) or back of a fire. A firefighter should never be uphill (at the head) of a fire where the rate of spread is the fastest. See the Standard Fire Orders (F-I-R-E-O-R-D-E-R-S) in the Fireline Handbook, PMS 410-1 or NFES 0065.
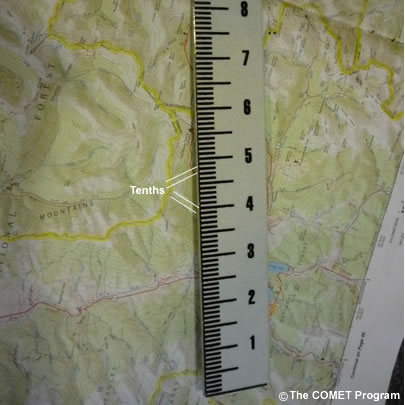
USING A SCALED RULER FOR SPREAD MEASUREMENTS
When drawing or measuring distances, a scaled ruler is sometimes necessary for direct measurements. A scaled ruler, or engineer's ruler, has 1-inch increments subdivided into 1/10-inch increments, convenient for ground measurements. Ground measurements are usually given in fractions of multiples of 10. Consider a map distance of 3.7 inches, where 1 inch equals 100 feet. In this case, each tenth of an inch will equal 10 feet. Consequently, 3.7 inches equals 370 feet.
MAP SPREAD WORKSHEET
All data collected and calculated related to spread distance and rate of spread can be put into a map spread worksheet.
Example 3 - Using a ruler scaled in 1/10 inch or 0.1 inch increments, draw a sketch of the burn in Example 2. The effective windspeed is 3 miles/hour. Complete the map spread worksheet. See the steps and illustrations below.
Step 1. Draw a line of 0.5 inches from point A up the slope to point B.
A - B
Step 2. See the fire shapes in the fire shape figure below to determine how wide to make the ellipse.
Step 3. Draw an ellipse around the line drawn.

Fire shape depends on effective windspeeds.
5.4 Perimeter and Area Estimation Charts
5.4 Perimeter and Area Estimation Charts Anonymous (not verified)The perimeter and area of a fire can be determined by using estimation charts as shown below. These charts require knowledge of the spread distance in chains and the effective windspeed in miles per hour. A fire area/size worksheet is provided to be filled out with the data collected.
EFFECTIVE WINDSPEED
Effective windspeed is the midflame windspeed, corrected for the effects of slope on fire spread. Changes in slope affect how wind influences a fire and the overall fire spread. For slopes above 20%, each additional 20% increase in slope translates to an additional 1 mph increase in the effective equivalent “upslope” component of the wind. For slopes between 20% and 40%, for example, a 1-mph slope-equivalent upslope component would be added to the flame-level wind. Between 40% and 60%, a 2-mph slope-equivalent upslope component would be added, and above 60%, flame-level winds would increase by 3 mph.

Click to view animation of slope effects on fire
Example 1 - A fire starts at point A. Given the following values, determine the fire perimeter.
rate of spread = 5 ch/h, projection time = 3 h, effective windspeed = 10 mi/h
Step 1. Use the equation for determining the spread distance (see Section 5.3).
ROS × PT = 5 ch/h × 3 h = 15 chains spread distance.
Step 2.> Look at the perimeter estimation chart. Find a spread distance of 15 chains on the vertical axis. Move your gaze across horizontally.
Step 3. Find an effective windspeed of 10 miles/hour on the horizontal axis, which is between 9 miles/hour and 11 miles/hour. Follow the column down vertically.
Step 4. Where the two lines intersect, read the number. In this case there are two numbers.
34 chains and 33 chains
Step 5. Take an average of the two values.
34.0 chains + 33.0 chains / 2 = 33.5 chains
The perimeter of the fire is 33.5 chains.
Example 2 - Determine the area of the fire in Example 1 and complete the fire area/size worksheet. The spread distance is the same, 15 chains.
Step 1. Reference the area estimation chart for a spread distance of 15 chains. Follow the row across horizontally.
Step 2. Look for an effective windspeed of 10 miles/hour, which is between 9 miles/hour and 11 miles/hour. Follow the column down vertically and read the numbers from the two windspeeds.
4.9 acres and 5.7 acres
Step 3. Take an average of the two values.
4.9 acres + 5.7 acres / 2 = 5.3 acres
The area of the fire is 5.3 acres.
Perimeter estimation for point source fires.
Area estimation for point source fires.
Fire Area/Size Worksheet
| Line | Input | ||
| 0 | PP | Projection point | A |
| 1 | ROS | Rate of spread, ch/h | 5 |
| 2 | EWS | Effective windspeed, mi/h | 10 |
| 3 | PT | Projection time, h | 3 |
| 4 | SDF | Spread distance, ch | 15 |
| Output | |||
| PER | Perimeter, ch | 33.5 | |
| AC | Area, ac | 5.3 |
5.5 Contour Lines and Intervals
5.5 Contour Lines and Intervals Anonymous (not verified)A contour line is a line drawn on a topographic map to indicate ground elevation or depression. A contour interval is the vertical distance or difference in elevation between contour lines. Index contours are bold or thicker lines that appear at every fifth contour line.
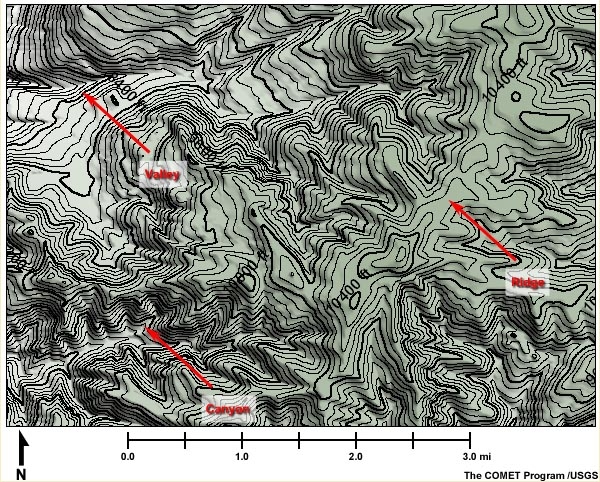
If the numbers associated with specific contour lines are increasing, the elevation of the terrain is also increasing. If the numbers associated with the contour lines are decreasing, there is a decrease in elevation. As a contour approaches a stream, canyon, or drainage area, the contour lines turn upstream. They then cross the stream and turn back along the opposite bank of the stream forming a "v". A rounded contour indicates a flatter or wider drainage or spur. Contour lines tend to enclose the smallest areas on ridge tops, which are often narrow or very limited in spatial extent. Sharp contour points indicate pointed ridges.
Example 1 - In the graphic below, what is the vertical distance between the contour lines?
Pick two contour lines that are next to each other and find the difference in associated numbers.
40 feet - 20 feet = 20 feet
The contour lines in this figure are equally spaced. The even spacing indicates the hill has a uniform slope. From the contour map, a profile can be drawn of the terrain.
Example 2 - Draw a profile showing the elevations of the contours.
Note: The intervals are increasing, therefore, the contours indicate a hill. The peak is normally considered to be located at half the interval distance.
Widely separated contour lines indicate a gentle slope. Contour lines that are very close together indicate a steep slope.
The figure above illustrates various topographic features. (b) Notice how a mountain saddle, a ridge, a stream, a steep area, and a flat area are shown with contour lines.
The figure above illustrates a depression and its representation using contour lines. Notice the tick marks pointing toward lower elevation.
![5_34[1].gif](https://fs-prod-nwcg.s3.us-gov-west-1.amazonaws.com/s3fs-public/2023-07/5_34%5B1%5D.gif)
Figure One
![5_33[1].gif](https://fs-prod-nwcg.s3.us-gov-west-1.amazonaws.com/s3fs-public/2023-07/5_33%5B1%5D.gif)
Figure Two
SLOPE PERCENT FROM TOPOGRAPHIC MAP
The horizontal distance between points A and B can be measured with a scaled ruler and used to determine the slope percent.
slope percent = rise/run × 100
Example 4 - What is the slope percent in Exercise 2 above?
slope percent = rise/run × 100.
For this computation, the rise, or vertical ground distance, and run, or horizontal ground distance, are needed.
Step 1. Measure the horizontal map distance between points A and B to get the vertical ground distance.
The horizontal map distance measures 0.5 inches.
Step 2. Use the appropriate conversion factor to convert the horizontal map distance to horizontal ground distance.
0.5 in × 24,000 in/in = 12,000 in
Step 3. The desired unit is feet. Set up the cancellation table so all units will cancel, except the desired unit, feet.
Step 4. Use the slope percent equation and solve. The run is 1000 feet and the rise in elevation is 120 feet.
slope percent = rise/run × 100
slope percent = (120ft / 1000ft) × 100 = 12%
Slope Worksheet - Use the information from the example above and complete the slope worksheet. Line 1 starts with the contour interval, not the projection point.
Slope Worksheet (to be completed)
| Line | Input | ||
| 0 | PP | Projection point | ______ |
| 1 | CON INT | Contour interval, ft | ______ |
| 2 | SLC | Map Scale | ______ |
| 3 | CF | Conversion factor, ft/in | ______ |
| 4 | #INTVLS | # of contour intervals | ______ |
| 5 | RISE | Rise in elevation, ft | ______ |
| 6 | MD | Map distance, in (between points) | ______ |
| 7 | HZGD | Horizontal ground distance, ft | ______ |
| Output | |||
| SLP% | SLOPE% | ______ |
Slope Worksheet (completed)
| Line | Input | ||
| 0 | PP | Projection point | A-B |
| 1 | CON INT | Contour interval, ft | 40 |
| 2 | SLC | Map Scale | 1:24,000 |
| 3 | CF | Conversion factor, ft/in | 2,000 |
| 4 | #INTVLS | # of contour intervals | 3 |
| 5 | RISE | Rise in elevation, ft | 120 |
| 6 | MD | Map distance, in (between points) | 0.5 |
| 7 | HZGD | Horizontal ground distance, ft | 1,000 |
| Output | |||
| SLP% | SLOPE% | 12 |
Table 5.1
Table 5.1 Anonymous (not verified)Map Scale Conversion Factors
| Scale | Representative Fraction | Map in/mi | Map in/ch | map ft/in |
|---|---|---|---|---|
| 1:253,440 | 253.44 | 0.25 | 0.0031 | 21,120 |
| 1:126,720 | 126.72 | 0.50 | 0.0063 | 10,560 |
| 1:63,360 | 63.36 | 1.00 | 0.0125 | 5,280 |
| 1:62,500 | 62.50 | 1.01 | 0.0127 | 5,208 |
| 1:31,680 | 31.68 | 2 | 0.025 | 2,640 |
| 1:24,000 | 24.00 | 2.64 | 0.033 | 2,000 |
| 1:21,120 | 21.12 | 3 | 0.038 | 1,760 |
| 1:15,840 | 15.84 | 4 | 0.05 | 1,320 |
| 1:7,920 | 7.92 | 8 | 0.1 | 660 |
Table 5.1. Map Scale Conversion Factors
Table 5.2
Table 5.2 Anonymous (not verified)Map Scales and Equivalents
| Scale | Inches per mile | Acres per square inch | Conversion factor that each dot equals |
|---|---|---|---|
| 1:20,000 | 3.168 | 63.769 | 1.736 Acres |
| 1:24,000 | 2.640 | 91.827 | 2.500 Acres |
| 1:62,500 | 1.014 | 622.449 | 16.946 Acres |
| 1:63,360 | 1.000 | 640.000 | 17.424 Acres |
Table 5.2 Acreage Grid Overlay, Map Scales, and Equivalents.
Table 5.3 Perimeter Estimation for Point Source Fires
Table 5.3 Perimeter Estimation for Point Source Fires Anonymous (not verified)
Table 5.4 Area Estimation for Point Source Fires
Table 5.4 Area Estimation for Point Source Fires Anonymous (not verified)