8.0 Fire Behavior - Introduction
8.0 Fire Behavior - Introduction Anonymous (not verified)Chapter 8 presents information related to midflame windspeeds, flame length, flame height, and other components of fire behavior. It includes techniques for estimating different fire parameters, including rate of spread, and provides charts, graphs, and worksheets to help determine such characteristics as probability of ignition and map spread distance.
8.1 Flame Height
8.1 Flame Height Anonymous (not verified)Flame height is the average height of flames as measured vertically, up and down. It may be less than flame length if the flames are angled in the horizontal direction, backward or forward.
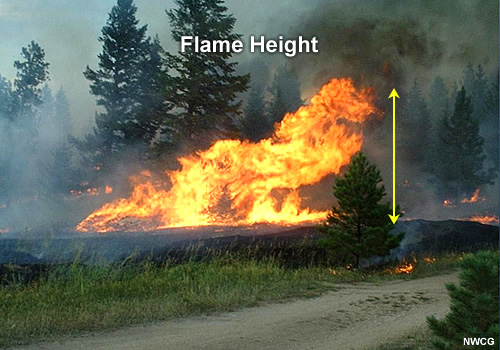
Flame height can be approximated by comparing the flame to an object of known dimensions, such as a pole, fencepost, or firefighter.
8.2 Midflame Windspeed
8.2 Midflame Windspeed Anonymous (not verified)Midflame windspeed (MFWS) is defined as the velocity of the winds, in miles per hour (mi/hr), taken at the mid-height of the flames. MFWS will directly affect the direction of movement of the flaming front and is important in fire spread calculations. The midflame windspeed is determined by use of the wind adjustment table, which provides values in terms of fuel overstory exposure and fuel model.
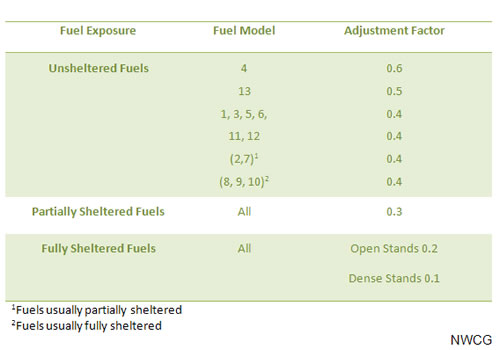
Figure 8.2 Adjustment factors for midflame winds.
The adjustment values are typically applied to the 20-foot windspeed, which is the speed that is measured 20 feet above any fuel or obstruction, usually by a weather station. The midflame windspeed is obtained by multiplying the 20-foot windspeed by the appropriate wind adjustment factor from the table.
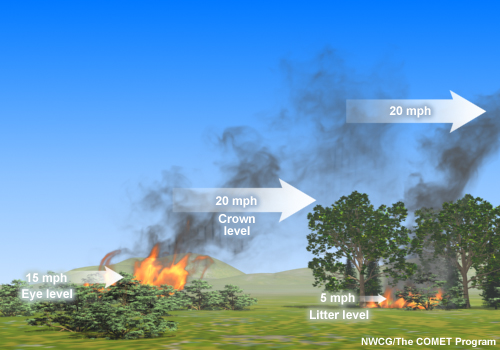
Figure 8.3 Effects of fuel sheltering on wind speeds.
It is very important to know which fuel model and sheltering configuration is being studied, and whether a given windspeed is a 20-ft windspeed or an already adjusted midflame windspeed.
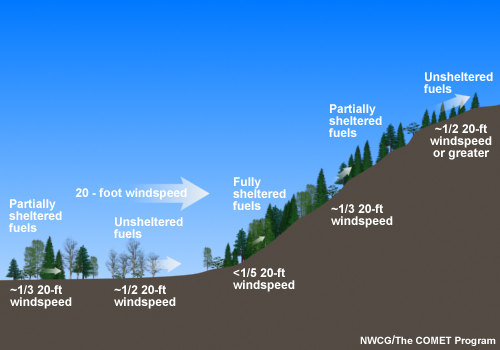
Figure 8.4 Typical fuel sheltering for slope locations.
The midflame windspeed will be LESS THAN the 20-foot windspeed, because vegetation and friction slow down winds closer to the surface. That is why all the adjustment factors in the table are less than 1.
Example 1 - A fire is burning in a fully sheltered area of dense, or closed, stands described as Fuel Model 4. The local weather station reports the 20-ft windspeed is 15 miles per hour. What is the midflame windspeed? Show all work on the wind adjustment worksheet (see below).
Solution - The figure above describes wind reduction factors and is used to determine the appropriate correction factor.
Step 1. The correction factor is 0.1 for any fuel model under fully sheltered conditions with dense stands.
Step 2. To find the midflame windspeed, multiply the 20-foot windspeed by the adjustment factor.
midflame windspeed =
20-foot windspeed × adjustment factor
MFWS = 15 mi/h × 0.1 = 1.5 mi/h
Example 2 - A 20-foot windspeed at the top of the ridge is reported to be 35 miles per hour, with fuel model 11 vegetation. What is the midflame windspeed?
Step 1. See figure 8.4. The top of a ridge is indicated to be unsheltered.
Step 2. From figure 8.2, the adjustment factor is 0.4.
Step 3. MFWS = 35 x 0.4 = 14 mi/h
The values can be summarized in a wind adjustment worksheet.
8.3 Rate of Spread
8.3 Rate of Spread Anonymous (not verified)The rate of spread is in chains per hour (ch/h) and is defined as the speed with which the fire is moving away from the site of origin. Wind, moisture, and slope drive the fire. The flaming zone, or fire head, moves away from the origin quickly with great intensity.
8.4 Flame Length & Spread Distance
8.4 Flame Length & Spread Distance Anonymous (not verified)The flame length is the distance between the flame tip and the midpoint of the flame depth at the base of the flame. Flame length is an observable, measurable indicator of fireline intensity.
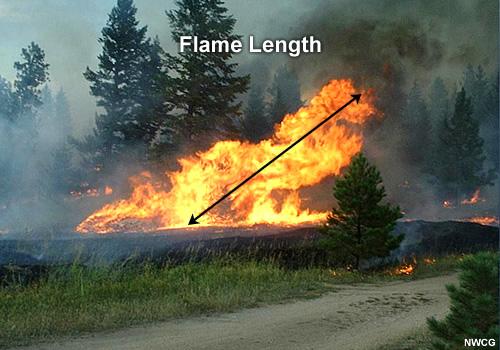
Spread distance, in chains, is the distance of forward fire spread for a specified amount of time.
spread distance (SD) =
rate of spread (ROS) × projection time (PT)
SD = ROS × PT
Example 1 - The rate of a fire spread is 4 chains per hour.
What will the spread distance be in 3 hours?
SD = ROS × PT = 4 ch/h × 3h = 12 chains
8.5 Map Spread
8.5 Map Spread Anonymous (not verified)Map spread, in inches, is the size of a fire as scaled to a map. See Section 5.3 for more detailed information.
Example 1. For a rate of spread of 4 chains/hour and a projection time of 3 hours, find the map distance for the fire spread. Plot the distance using a tenths ruler for accuracy. The map scale is 1:24,000.
Step 1. Convert the map scale to feet per inch. 24,000 in × 1 foot/12 in = 2000 feet.
Step 2. Convert the spread distance to feet. 12 chains × 66 feet/chain = 792 feet.
Step 3. Convert the ground spread distance to a map spread distance. 792 feet × 1 inch/2000 feet = 0.4 inch
Step 4. Using a ruler, measure the distance from the point of origin to the distance of the fire spread.
Map spread distance is 0.4 inch.
8.6 Head, Flank, and Rear Fire Terms
8.6 Head, Flank, and Rear Fire Terms Anonymous (not verified)Each side of the fire is described in terms of head, flank, and rear. The head is the fastest spreading part of a fire's perimeter. The head is usually the side toward which the wind is blowing, and will also often be the upslope side of a fire. The head of the fire is of primary interest.
The right and left flanks describe the sides of the fire. Flanks are perpendicular to the head of the fire.
The rear of the fire is the side of the fire opposite the head.

Click on the graphic above to view animation of fire spread along head, flank, and rear
Example 1 - Plot the perimeter and label the head, rear, and flanks of a fire with ROS of 4 chains/hour and PT of 3 hours. Assume the wind is blowing from left to right across the page.
The head of the fire on your drawing should correspond to the edge of the fire's forward perimeter at the projection time. The distance from head to rear will correspond to the spread distance, in this case 12 chains.
8.7 Slope Effect on ROS
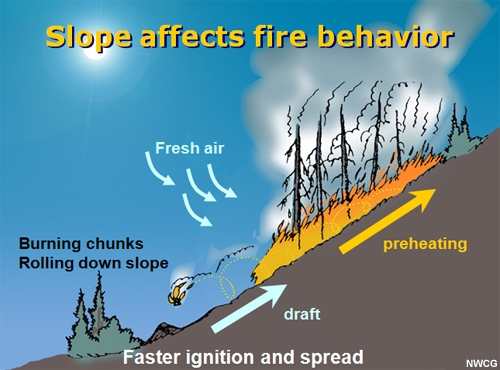
8.7 Slope Effect on ROS Anonymous (not verified)When fire moves upslope, the fuel ahead of the flame front is closer to the flame than if the slope were flatter. This set-up "preheats" the fuels. The effects of slope on fire spread become greater as the slope increases.
APPROXIMATING THE ROS
An easy guide for approximately the ROS due to changes in slope is as follows:
1. The first tripling of slope roughly increases the rate of fire spread by a factor of 2.
2. The second tripling of slope increases the rate of spread by a factor of 4 to 6, depending on fuel conditions.
The effect of an increase in slope on ROS depends both on the absolute slope as well as on the midflame wind speed. See Section 8.2 for more information on midflame and "effective" wind speeds.
Example 1 - An area of shrubs is burning at a ROS of 4 chains per hour at an 8 percent slope. The slope increases to 24 percent. What will the ROS be?
Step 1. How much did the slope change? The slope percent increased from 8 percent to 24 percent. This change represents an increase of three times the original slope.
Step 2. How much will this slope change affect the ROS? As stated above, a tripling of slope increases the ROS by a factor of 2.
2 × 4 chains/hr = 8 chains/hr
4 chains/hr × 2 = 8 ch/hr
8.8 Probability and Number of Ignitions
8.8 Probability and Number of Ignitions Anonymous (not verified)Probability is the chance that an event will happen and is expressed in terms of percent, or per 100. For example, if there is a 40 percent chance of a spot fire starting, that means that out of 100 glowing embers that fly off, 40 embers will likely start spot fires, and 60 will not. Percent is calculated by changing the percent into a fraction by dividing by 100, then multiplying by the total number of possible situations.
Example 1 - The probability of ignition is 80 percent. How many ignitions are likely to occur if 90 glowing firebrands land on receptive fuel?
Step 1. Change 80 percent to a fraction, 80/100 and then into a decimal. 80/100 = 0.80
Step 2. Multiply by the total number of situations, in this case glowing firebrands. 0.8 × 90 = 72
Expect 72 ignitions out of 90 glowing firebrands